Getting data in and out of R (Part 1)
I guess one major thing that scares people away from R (and makes them turn to ‘fluffy’ packages like SPSS etc.) is the seeming lack of the familiar spreadsheet user interface.
A couple of persons told me that they have trouble getting their data into SPSS, so they think they’d never be able to do it in R.
I have to disagree with them and below is a small list of I/O-related myths about R that need to be busted.
Myth 1: There are no spreadsheets in R!
No, there is a way to view your data in spreadsheet format and you can even input/edit your data using the same view.
Let’s generate a data frame containing seven variables with five (random) observations:
> set.seed(55)
> d = data.frame(v1 = rnorm(5), v2 = rnorm(5), v3 = rnorm(5), v4 = rnorm(5),
                 v5 = rnorm(5), v6 = rnorm(5), v7 = rnorm(5))
If we print this object, we get something like:
> dv1 v2 v3 v4 v5 v6 1 0.120139084 1.1885185 -0.04891095 -0.3662780 -1.5192720 0.960344 2 -1.812376850 -0.5053439 -0.84323377 2.3553639 1.4971178 -0.692181 3 0.151582984 -0.0992344 -2.07527077 1.0933772 0.8196153 1.405998 4 -1.119221005 0.3053532 -0.36076315 0.2858410 1.0660504 -1.633539 5 0.001908206 0.1984097 -0.63768966 0.9936578 0.7337559 0.261831 v7 1 1.5647544 2 0.3145893 3 -0.9346850 4 -0.1251366 5 -0.5267137
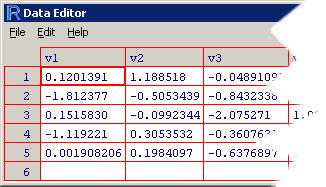
 This kind of display is cumbersome because the set is split across variables (and we just have five observations and seven variables!). To destroy the first myth, use the
 edit() function on the data frame and you will see your data in a neat spreadsheet.
> edit(d)
But R can do a lot more. Suppose you want to enter some data manually. Create a new object and assign an empty data frame to it.
 > dat.man = edit(data.frame())
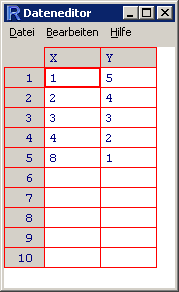
The spreadsheet appears and you can change the variable names by clicking on them. I typed in the following data and viewed them again in R:
> dat.manX Y 1 1 5 2 2 4 3 3 3 4 4 2 5 8 1
If you spot a mistake in your data input, you’d have to assign the correct value to that cell. In larger sets it can be annoying to get the indices right, so you can use the edit() function to do this ‘graphically’.
dat.man = edit(dat.man) opens the editor again and you can go to the cell and edit the value. Note that you have to assign the edit() function’s result to an object. By using the fix() function you don’t have to reassign the edited data to the original object, so these two commands do the same:
> dat.man = edit(dat.man)
> fix(dat.man)
Nice job! But where is Myth No.2 and 3?
Actually I wanted to include all myths in one post, but I decided to publish them separately, so stay tuned for more. 😉
heh – who told you those dirty tricks?
Honestly, I don’t remember. Perhaps somewhere on CRAN, in a book or someone told me. Sometimes you just happen to pick up a few useful things along the way that make your work easier.