Getting data in and out of R (Part 3)
Myth 3a: You can’t get data from Excel into R easily.
Nope. Although R can read data from all kinds of files (txt, csv, xls, dta, sav, …), there’s a quick way of transferring your from Excel to R.
Caveat: I haven’t tested how this works for other operating systems and/or spreadsheet programs – I have used Windows XP and Excel 2003 for all examples presented below.
Vectors
Method A
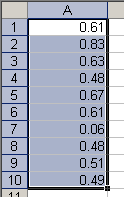
Getting a column of data into R is no big deal. Select what you want, copy it and enter data.object = scan(). Instead of entering single values as we did in the previous post, just paste the copied contents and submit a blank line to terminate scan():

Copy a vector in Excel
> data.object = scan() 1: 0.61 2: 0.83 3: 0.63 4: 0.48 5: 0.67 6: 0.61 7: 0.06 8: 0.48 9: 0.51 10: 0.49 11:Read 10 items> data.object[1] 0.61 0.83 0.63 0.48 0.67 0.61 0.06 0.48 0.51 0.49
If you have strings to read, remember specifying scan(what="character") (see part 2).
Method B
Instead of scanning all values, you can directly read the clipboard’s contents like this:
> data.clipb = readClipboard() > data.clipb[1] "0.61" "0.83" "0.63" "0.48" "0.67" "0.61" "0.06" "0.48" "0.51" "0.49"
Important: note that the created object will be character, so you have to convert the object to numeric.
> class(data.clipb)[1] "character"> data.clipb = as.numeric(data.clipb)
Matrices
To read matrices from Excel, you need the read.table() function (for help and options see ?read.table). You don’t have to pay attention to data types because R creates a data.frame and assigns suitable types to each column (i.e. variable).
Without Variable Names

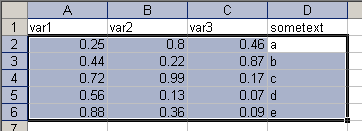
Copying data from Excel without variable names
By default, read.table() has the option header=FALSE, this means that the first row is not interpreted as variable names, so I only select and copy the values of three numeric and one string variable. Now create a new object and assign read.table(file="clipboard") to it.
> data.noheader = read.table( + file="clipboard") > data.noheaderV1 V2 V3 V4 1 0.25 0.80 0.46 a 2 0.44 0.22 0.87 b 3 0.72 0.99 0.17 c 4 0.56 0.13 0.07 d 5 0.88 0.36 0.09 e
We see that the data were read successfully. To check the view internal structure of the data frame, type
> str(data.noheader)'data.frame': 5 obs. of 4 variables: $ V1: num 0.25 0.44 0.72 0.56 0.88 $ V2: num 0.8 0.22 0.99 0.13 0.36 $ V3: num 0.46 0.87 0.17 0.07 0.09 $ V4: Factor w/ 5 levels "a","b","c","d",..: 1 2 3 4 5
From this we see that our data frame has four variables with five observations. Three variables are numeric and for the string variable, a factor with five levels was created.
With Variable Names

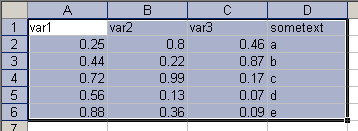
Copying data with variable names
If you have variable names in the first row of your data set, you just have to add the option header=TRUE:
> data.header = read.table( + file="clipboard",header=TRUE) > data.headervar1 var2 var3 sometext 1 0.25 0.80 0.46 a 2 0.44 0.22 0.87 b 3 0.72 0.99 0.17 c 4 0.56 0.13 0.07 d 5 0.88 0.36 0.09 e
Problems with decimals
One problem I have not covered up to this point is the usage of other delimiters and decimal point characters. For instance, if you live in Germany, your operating system will most likely interpret decimal characters as a comma. So if you had problems using the scan() and read.table() function this may be the reason. To circumvent related problems, both functions have an option dec that is dec="." by default. Adjust this setting to whatever character you use as a decimal point and it should work fine.
> comma.values = scan(dec=",") 1: 1,1 2: 2,2 3: 3,3 4: 4,4 5:Read 4 items> comma.values[1] 1.1 2.2 3.3 4.4
Problems with delimiters
read.table() assumes that columns are separated by a tabulator – and that’s fine for Windows because copied matrices will have this format, but if you need another delimiter (e.g. comma, semicolon or a blank) use the option sep=",". I copied this to my clipboard in plain text:
1;2;3;4
5;6;7;8
9;9;9;9
Specifying the delimiters in R gives you the correct results
> read.table("clipboard",sep=";")V1 V2 V3 V4 1 1 2 3 4 2 5 6 7 8 3 9 9 9 9